Hello GTDB team,
Thanks for this new release, I can only appreciate the amount of work and curation that goes into this essential resource!!
I was puzzled to notice that one of my isolates previously assigned to the species cluster of Escherichia coli in r226 is now assigned to the newly formed ECMA0423 species cluster ( GTDB - Loading... ). Given the large sizes of this cluster (13k) and the remaining Escherichia coli (36k), I was surprised that this split was not documented in the release notes.
I was especially concerned as to why a MAG of relatively medium quality was selected as the representative of this species cluster (among 13k genomes, including some isolates).
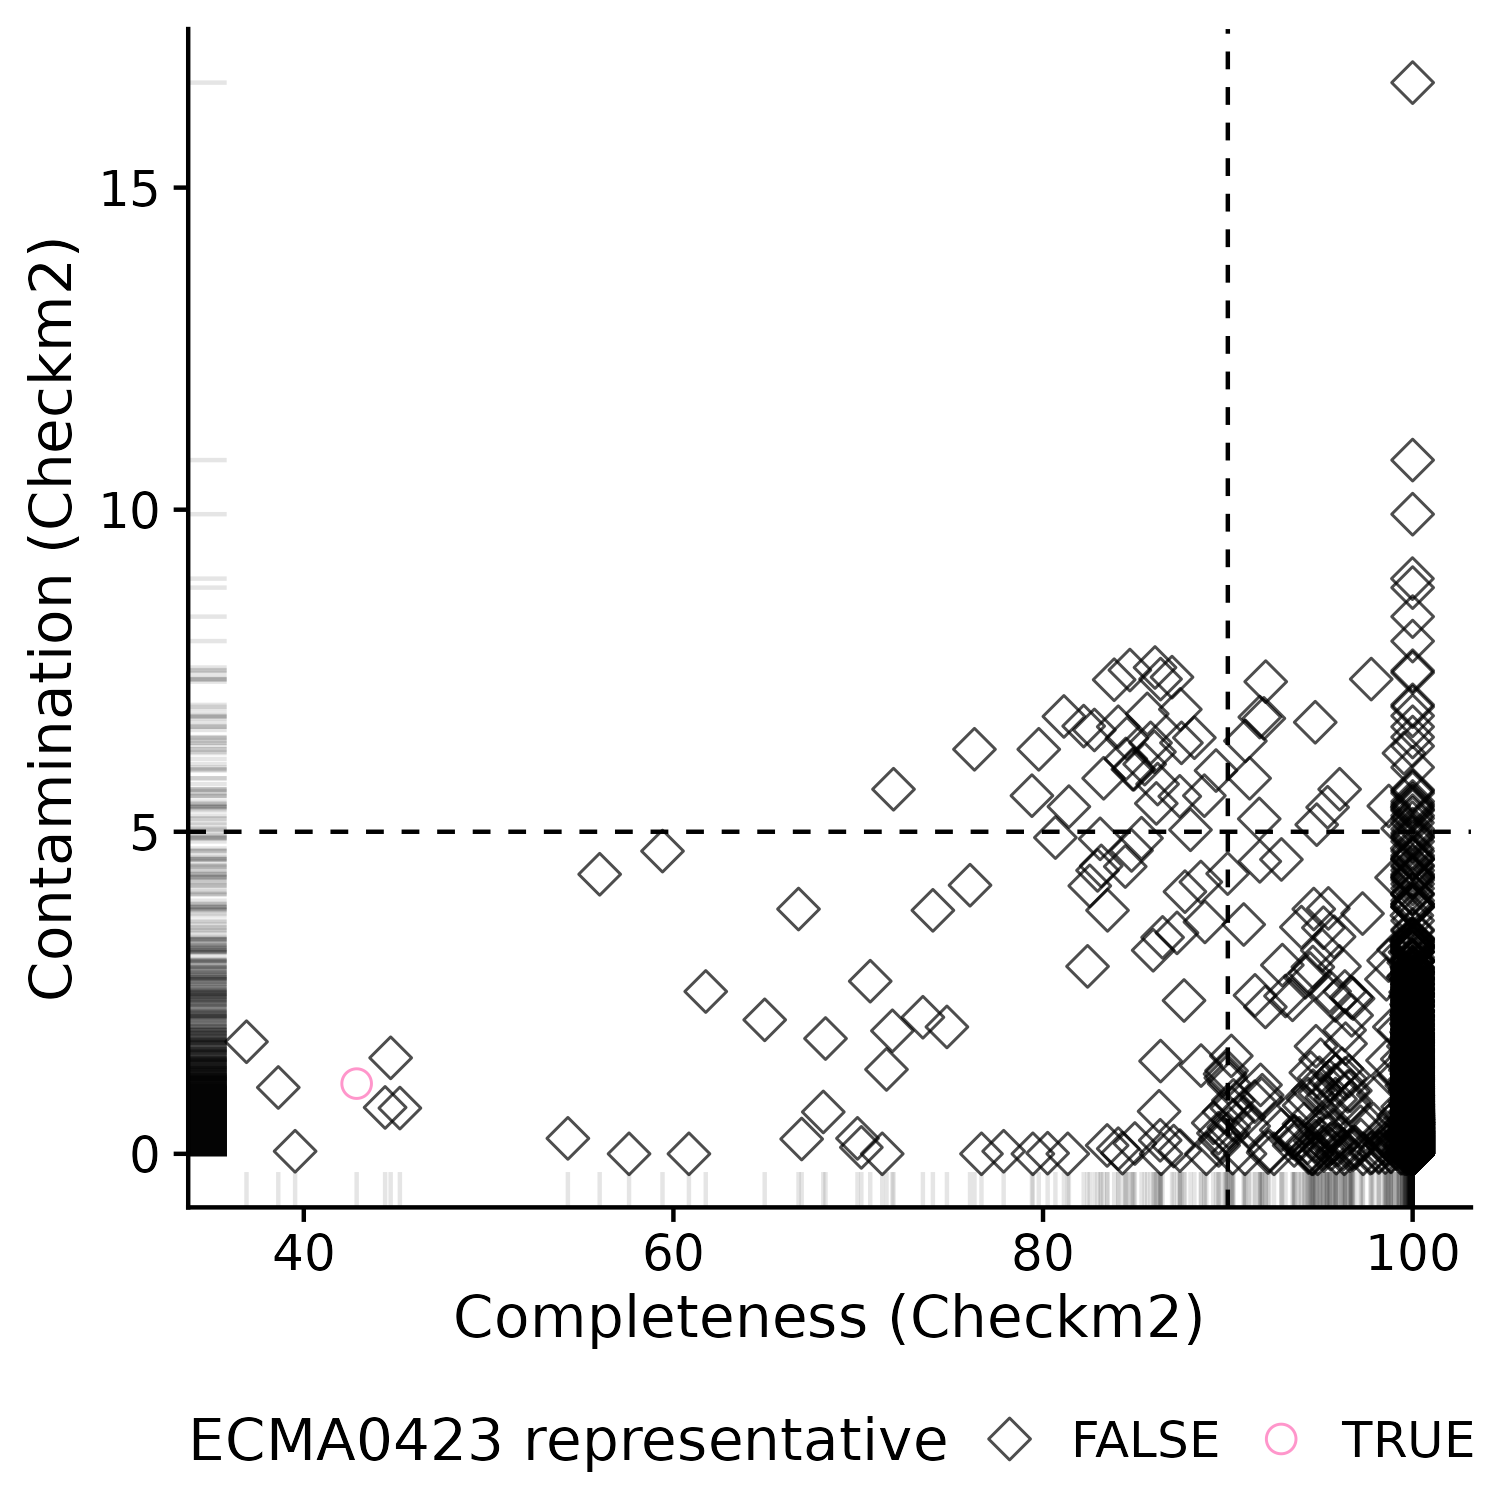
In particular, I spotted these two genomes from isolates with few contigs and perfect Checkm scores:
- RS_GCF_900457155.1
- RS_GCF_002950395.1 https://gtdb.ecogenomic.org/genome?gid=GCF_002950395.1
I can only imagine that clustering such a large quantity of genomes must come with compromises, but I fail to understand the choices for this one. I would be very grateful for pointers to understand the decisions. Please find below the code to get the data and to reproduce the figure.
All the best,
Charlie
PS: can’t add all the links as a new user sorry.
aria2c -c -s 16 -x 16 -k 1M -j 1  https://data.gtdb.aau.ecogenomic.org/releases/release232/232.0/bac120_metadata_r232.tsv.gz
csvtk filter2 -t -o subset_ECMA0423.tsv -f '$gtdb_genome_representative=="GB_GCA_047199055.1"' bac120_metadata_r232.tsv.gz
library(readr)
library(ggplot2)
library(cowplot)
ecma <- read_tsv("/data/subset_ECMA0423.tsv")
p <- ggplot(ecma, aes(x = checkm2_completeness, y = checkm2_contamination))+
  geom_point(aes(color =gtdb_representative, shape = gtdb_representative ), alpha = 0.7, size = 3)+
  scale_shape_manual(values = c("TRUE"=1, "FALSE"=5))+
  scale_color_manual(values = c("TRUE"="#FF69B4", "FALSE"="black"))+
  geom_rug(alpha=0.1)+
  geom_hline(yintercept = 5, linetype = "dashed")+
  geom_vline(xintercept = 90, linetype = "dashed")+
  labs(x="Completeness (Checkm2)", y = "Contamination (Checkm2)", color = "ECMA0423 representative",
       shape = "ECMA0423 representative")+
  theme_cowplot()+theme(legend.position = "bottom")

ggsave("/data/plot_ECMA0423.png",p, width = 5, height = 5, units = "in", bg = "white")